December 14, 2011
Provided by Hep Magazine
by Tim Horn
The approval of two hepatitis C protease inhibitors, the first evidence of interferon-free regimens curing hep C, and a handful of studies touting the potential health benefits of coffee all make the top 20 list of viral hepatitis news in 2011.
Hep C Infection Rates Slow to Decline Among Injection Drug Users
The substantial decline in new HIV cases among injection drug users (IDUs) in Baltimore has not been matched by reductions in the number of new hepatitis C cases, according to a study published in the March issue of The Journal of Infectious Diseases. Likely reasons? The prevalence of hepatitis C virus (HCV) is four times that of HIV in the United States—roughly 4 million compared with 1.2 million living with HIV—and the fact that the risk of passing along HCV is roughly 10 times that of HIV. Sharing needles even once can be enough to transmit hep C, making it a much greater threat to those who make only intermittent use of sterile needles and needle exchange programs. Adding insult to injury, experts note, is that harm reduction measures such as needle exchange and opioid substitution treatment don’t get enough support and aren’t sufficiently accessible to drug users.
Treatment for Depression Increases Hep C Adherence
Depression isn’t just feeling blue—it can be debilitating, and it can seriously sabotage efforts to effectively treat hepatitis C. New data confirm what experts have long suspected, that antidepressants can significantly boost treatment adherence rates in people living with hepatitis C, notably those being treated with interferon—a drug known to cause and exacerbate depression. “All health care professionals, including pharmacists, need to know how to detect depression and work together to support safe, effective and affordable treatments,” the researchers conclude.
Breakthrough: Non-Interferon/Ribavirin Regimen Can Cure Hep C
In what was heralded as a research breakthrough, preliminary data reported in April suggested that at least some cases of chronic HCV infection can be cured without the use of either pegylated interferon or ribavirin. The study combined Bristol-Myers Squibb’s protease inhibitor BMS-790052 and NS5A inhibitor BMS-650032, without interferon and ribavirin, and managed to cure four of 11 people with otherwise difficult-to-treat genotype 1 HCV and who had not responded favorably to earlier therapy attempts. It was the first study to indicate that interferon- and ribavirin-free regimens could work—findings that raised the stakes for all other drug companies with promising HCV agents in development.
FDA Approves Merck’s Hep C Drug Victrelis (Boceprevir)
FDA Approves Incivek (Telaprevir), Second New Hep C Drug
The era of “direct acting antivirals” was officially ushered in with the May 12 and May 23 approvals of two long-awaited hep C protease inhibitors: Victrelis (boceprevir) and Incivek (telaprevir). When they’re used in combination with pegylated interferon and ribavirin, people with genotype 1 HCV stand a 70 percent chance of clearing the virus, sometimes with as little as six months of treatment.
“With the approval of [Victrelis and Incivek], there are now two important new treatment options for hepatitis C that offer a greater chance at a cure for some patients with this serious condition,” said Edward Cox, MD, MPH, director of the Office of Antimicrobial Products at the FDA’s Center for Drug Evaluation and Research. “The availability of new therapies that significantly increase responses while potentially decreasing the overall duration of treatment is a major step forward in the battle against chronic hepatitis C infection.”
Fair Pricing Coalition Voices Concern About High Cost of Merck’s Victrelis
Fair Pricing Coalition Says Vertex’s Incivek Price “Outrageous”
Soon after Victrelis and Incivek were approved by the U.S. Food and Drug Administration, activists sounded the alarm regarding the drugs prices. In separate statements five days apart, the Fair Pricing Coalition (FPC) said that Incivek’s price tag of $49,200 per 12-week course and Victrelis’s $1,100 weekly cost would adversely affect the ability of people with HCV to access the drugs, while also setting an excessively unreasonable future price point for the many hepatitis C drugs in the pipeline. “If each of the new drugs costs $50,000, we are looking at regimens that will ultimately cost between $150,000 and $200,000 in the very near future,” said FPC member Murray Penner. “This is unsustainable and will unacceptably limit access to the regimens.”
HHS Launches Viral Hepatitis Action Plan
In May, the U.S. Department of Health and Human Services (HHS) issued its long-awaited Combating the Silent Epidemic of Viral Hepatitis: Action Plan for the Prevention, Care and Treatment of Viral Hepatitis—the government’s blueprint outlining plans to fight viral hepatitis in the United States. By 2020, the goals of the plan include: increase the number of people who are aware they have hepatitis B from 33 percent to 66 percent; increase the number of people who are aware they have hepatitis C from 45 percent to 66 percent; reduce new cases of hep C by 25 percent; and eliminate mother-to-child transmission of hep B.
Drinking Coffee Doubles Hep C Treatment Responses
Coffee Helps Minimize Hepatitis C Treatment Side Effects
Coffee Slows Progression of Hep C Liver Disease
Is there anything a good cup of coffee (or three) can’t do? Not only does coffee consumption slow liver disease progression and increase the chances of success while undergoing treatment for chronic hepatitis C infection, but drinking three or more cups a day also appears to reduce the incidence of hep C treatment side effects by more than 80 percent.
Curing Hepatitis C Reduces Death From Any Cause
Higher Rates of Non-Liver-Related Deaths in Chronic Hep C
People who have been treated for chronic hepatitis C virus (HCV) infection—and cured—are not only much less likely to die of liver failure or liver cancer, but they are also less likely to die from non-liver-related health problems, according to June 2011 research findings. The drop in death rates from any cause is an unexpected benefit from curing hepatitis C, especially because another study published this summer found that chronic hepatitis C doubles the risk of death from all causes.
Hepatitis C in the U.S. May Be Underestimated by Over a Million
The number of people who have been infected with hepatitis C virus (HCV) may have been undercounted by a whopping 1.1 million, according to new estimates from a paper published in the September 2011 edition of Liver International. Epidemiologists believe that at least 5.2 million people in the United States are HCV antibody positive—meaning that they were infected at one time, although they may not have developed chronic hepatitis C—an increase of 1.1 million over The National Health and Nutrition Examination Survey (NHANES) estimate of 4.1 million cases.
Hep C Inhibitor PSI-7977 Goes Interferon-Free in Phase III Studies
HIV Drug Giant Gilead Acquires Pharmasset, a Hep C Drug Development Leader
12 Weeks Interferon-Free PSI-7977 Regimen Cures 100 Percent Hep C Genotype 2/3
Princeton, New Jersey–based Pharmasset—recently acquired by pharmaceutical giant Gilead Sciences—announced in November that it is putting its lead experimental hepatitis C nucleotide inhibitor PSI-7977 to the test in three late-stage clinical trials exploring the drug’s safety and efficacy as a component of a regimen that only needs to be taken for three months and that doesn’t include pegylated interferon. The high-stakes decision is based, in part, on preliminary results from a Phase II study in which 10 out of 10 people with genotype 2 or 3 HCV infection were cured after 12 weeks of treatment with a regimen that included PSI-7977 and ribavirin, but not pegylated interferon. If all goes well in the studies, the company will petition the U.S. Food and Drug Administration to begin the process of reviewing PSI-7977 for approval sometime in the second half of 2013.
Five-Year Viread Follow-Up: Long-Term Hep B Suppression, Plus Fibrosis and Cirrhosis Improvements
Data continue to mount, indicating that not only can hepatitis B virus (HBV) medications work for many years, but they can also help reverse liver fibrosis and even cirrhosis in people living with the infection. According to new study results presented at the 62nd annual meeting of the American Association for the Study of Liver Diseases (AASLD), held in San Francisco in November, Viread (tenofovir) maintained long-term viral suppression of HBV—over a period of five years for the majority of participants enrolled in two clinical trials—with 88 percent experiencing improvements in liver health measurements.
Testing All Baby Boomers for Hep C Would Find 86% of Infections
Testing all U.S. baby boomers—individuals born between 1945 and 1965—for hep C infection would help identify more than 800,000 people living with the virus, or roughly 86 percent of those who are infected and at risk for potentially fatal liver disease but don’t yet know it. This idea is based on data reported at AASLD, along with the suggestion that testing all baby boomers is a cost-effective first step in the prevention of serious HCV-related disease.
OraQuick HCV Test Gets Clearance for Wider Use
Good news for doctor’s offices, outreach clinics and community-based organizations looking to use OraSure Technologies’ rapid test for hepatitis C virus (HCV): According to a December announcement, the test has been granted a CLIA waiver, meaning that its use is no longer limited to professionals who have received laboratory certification from the U.S. Department of Health and Human Services. OraQuick’s assay remains the only U.S. Food and Drug Administration–approved rapid test to detect antibodies to HCV, which causes liver disease. The test, using fingerstick or vein-drawn blood specimens, provides results in 20 minutes. “The CLIA waiver will enable health care providers, those on the front lines of fighting this devastating disease, to use this simple and accurate test in physician offices and outreach settings so more individuals infected with hepatitis C can be diagnosed and treated,” said Douglas Michels, president and chief executive officer of OraSure Technologies.
Source
January 2, 2012
Specialty med, storied launch
January 01, 2012
Knowing your competition is always helpful,” offers Paul Daruwala, VP of marketing, Vertex Pharmaceuticals. Daruwala spent 18 years at Merck, cutting his teeth on the drugmaker's hepatitis C pipeline before leaving to head up Vertex's HCV franchise. That bred a healthy respect. “But ultimately,” he says, “how you market is like stepping onto the field. You know you're going to play your game.”
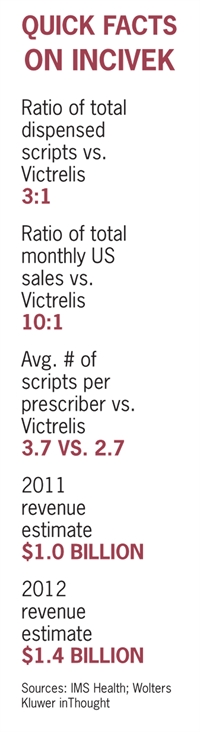
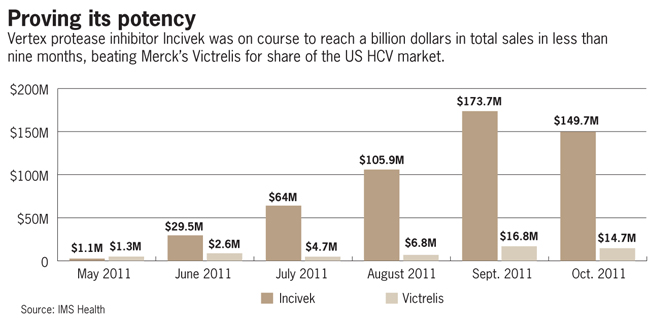
Sticking to their game fueled the success of the brand team behind Incivek, even as it faced a daunting rival in Merck, already a presence with older HCV products PegIntron and Rebetol, and whose protease inhibitor, Victrelis, gained approval a week before Incivek.
Some analysts had predicted a fifty-fifty split despite the perception that Incivek was more potent. With Incivek likely to go blockbuster in under nine months, setting a new commercial record, Daruwala's crew has turned what appeared to be an early disadvantage into a mere footnote in the annals of biopharma lore.
“We [didn't] get carried away in worrying what [Merck is] going to do so much, as opposed to what we need to do to really educate,” Daruwala says. “That's where I placed the focus for the team.”
Before launch, Merck signed a co-promotion deal with Roche, seller of its own HCV brands, effectively doubling the marketing muscle behind Victrelis. But Incivek's Phase III data had shown a 79% sustained viral response for those new to treatment (vs. 66% for Victrelis) and the promise to cut treatment time in half. That tilted the playing field in Incivek's favor, dictating a product positioning from which Vertex never really strayed.
The rest of the story is one of tight coordination and smooth execution. “This was [the company's] first launch and was such an important [one],” says Pamela Stephenson, VP of marketing in charge of the Incivek brand. “There was a lot of dedication, commitment and passion to getting [it] right.”
A big challenge was educating physicians, patients and nurses about taking Incivek along with interferon and ribavarin, each dosed and administered differently. Total duration is six months or a year, depending on response, and things can get confusing.
The literature showed that, “with really complicated treatment regimens, the more the patient is prepared, understands the consequences of their disease, and is ready to make a lifestyle change, the better they are with adherence,” explains Meredith Manning, senior director of marketing, who headed up patient education.
Prior to launch, Vertex set up an unbranded patient education site, BetterToKnowC.com, using it to provide information about the virus, along with a professional education site at HCVInsights.com, to jumpstart non-product scientific dialog.
With final approved label in hand, Vertex got educational information (sans promotional claims) to sales reps, and used a satellite webcast to beam it to the speakers bureau, arming them with more than just the package insert.
A treatment management guide had pictures to help providers manage the main side effect—rash. The guide “enabled providers to act confidently, assess the rash and take appropriate action,” explains Dallan Murray, senior director of marketing with a focus on HCPs.
Now that Vertex has DDMAC sign-off on its marketing claims, Incivek.com and a branded DTC campaign set to start this month feature actual patients.
Effects of Maternal Screening and Universal Immunization to Prevent Mother-To-Infant Transmission of HBV
Gastroenterology. 2011 Dec 22. [Epub ahead of print]
Chen HL, Lin LH, Hu FC, Lee JT, Lin WT, Yang YJ, Huang FC, Wu SF, Chen SC, Wen WH, Chu CH, Ni YH, Hsu HY, Tsai PL, Chiang CL, Shyu MK, Lee PI, Chang FY, Chang MH.
Source
Department of Pediatrics, National Taiwan University College of Medicine and Hospital, Taipei, Taiwan; Department of Primary Care Medicine, National Taiwan University College of Medicine and Hospital, Taipei, Taiwan; Department of Hepatitis Research Center, National Taiwan University Hospital, Taipei, Taiwan.
Abstract
BACKGROUND & AIMS:
Mother-to-infant transmission is the major cause of hepatitis B virus (HBV) infection among immunized children. There has been much debate about screening pregnant women and administering hepatitis B immunoglobulin (HBIG) to newborns. We analyzed the rate of HBV infection among children born to hepatitis B surface antigen (HBsAg)-positive mothers and whether HBIG administration reduces transmission.
METHODS:
We analyzed data from 2356 children born to HBsAg-positive mothers, identified through prenatal maternal screens. In addition to HBV vaccines, HBIG was given to all 583 children with hepatitis B e antigen (HBeAg)-positive mothers and to 723/1773 children with HBeAg-negative mothers. Serology tests for HBV were performed from 2007 to 2009, when children were 0.5-10 years old.
RESULTS:
A significantly greater percentage of children with HBeAg-positive mothers tested positive for antibodies against the hepatitis B core protein (anti-HBc, 16.76%) and HBsAg (9.26%) than children with HBeAg-negative mothers (1.58% and 0.29%, respectively; P<.0001 and <.001). Among the HBV infected children, the rate of chronicity was also higher among children with HBeAg-positive mothers than children with HBeAg-negative mothers (54% vs 17%; P=.002). Similar rates of anti-HBc (0.99% and 1.88%; P=.19) and HBsAg (0.14% and 0.29%; P=.65) were noted in children born to HBeAg-negative mothers that were or were not given HBIG. Infantile fulminant hepatitis developed in 1/1050 children who did not receive HBIG (.095%).
CONCLUSIONS:
Children born to HBeAg-positive mothers are at greatest risk for chronic HBV infection (9.26%), despite immunization. Administration of HBIG to infants born to HBeAg-negative mothers did not appear to reduce the rate of chronic HBV infection, but might prevent infantile fulminant hepatitis. Screening pregnant women for HBsAg and HBeAg might control mother-to-infant transmission of HBV.
Copyright © 2011 AGA Institute. Published by Elsevier Inc. All rights reserved.
Cost-Effectiveness Analysis of HIV/AIDS Prevention Interventions
December 30, 2012
Introduction
The CDC Division of HIV/AIDS Prevention is pleased to provide a basic guide to the cost-effectiveness analysis of HIV/AIDS prevention interventions. The purpose is to make this literature more accessible to researchers and to help prevention program staff and planners become more familiar with potential uses of economic evaluation.
This guide consists of two sections. The first section introduces the basic concept of cost-effectiveness analysis. The second section provides the sources of basic model inputs commonly used in the literature. Significant publications in the field and other related sources are also provided at the end.
Overview of Cost-Effectiveness Analysis
What Is Cost-Effectiveness Analysis?
Cost-effectiveness analysis (CEA) is a type of economic analysis where both the cost and the outcome (impact, result, effect, benefit, health gain ...) of an intervention are evaluated and then expressed in the form of a cost-effectiveness ratio. The numerator of the cost-effectiveness (CE) ratio represents the cost of the intervention associated with one unit of "outcome". The denominator is the unit of outcome. It can be expressed using many types of measures including: years of life gained, quality-adjusted life years gained (QALYs), new diagnoses, infections averted, and deaths averted. CEA is usually conducted on interventions that are known to be effective.
The CE ratio is a fraction used to compare the relative costs and outcomes of two or more interventions. In Example 1, the outcome measure chosen is "new HIV diagnoses" and the CE ratio of the programs evaluated is expressed in terms of "cost per new HIV diagnosis". The CE ratio of Program A is $41,667 per new HIV diagnosis. This ratio does not reveal the cost of implementing the program nor the number of new HIV diagnoses detected by the program. However, when comparing the CE ratio of Program A to that of Program B, we can say that Program B is more cost-effective than Program A when CE is measured in terms of "cost per new HIV diagnosis," because at $7,400 per new HIV diagnosis, Program B is less costly for the same outcome.
Cost per new HIV diagnosis
HIV interventions, such as screening and partner services, are intended to identify HIV-positive persons who are unaware of their infection. When evaluating several such programs in CE analysis, the outcome "new HIV diagnoses" is often used to enable a comparison across these programs; so the CE ratio is expressed in terms of cost per new HIV diagnosis.
Cost per infection averted (IA)
HIV prevention interventions such as syringe exchange programs, counseling for at-risk youth or post-exposure prophylaxis are intended to prevent (avert) infection in HIV-negative persons. Such programs can be evaluated to determine the number of infections prevented that would have otherwise occurred had the intervention not been provided. When evaluating several such programs in CE analysis, the outcome "HIV infections averted" is often used to enable a comparison across these programs; so the CE ratio can be expressed in terms of cost per infection averted.
The lifetime treatment cost of an HIV infection can be used as a conservative threshold value for the cost of averting one infection. Currently, the lifetime treatment cost of an HIV infection is estimated at $379,668 (in 2010 dollars), therefore a prevention intervention is deemed cost-saving if its CE ratio is less than $379,668 per infection averted.
As an outcome, the number of HIV infections averted due to a program can be evaluated using different mathematical techniques that vary in complexity and the amount of data or number of assumptions required. Attention should be paid to the timeframe of the intervention effect considered in the evaluation. For example, if the timeframe is one year, then the cost may have to be incurred annually in order to continue to avert the HIV infections.
Cost per life year (LY) gained
HIV treatment interventions, including retention in care and treatment adherence, are in part intended to extend the lives of HIV-positive persons. Such programs can be evaluated to determine the number of additional life years gained (or saved) that otherwise would have been lost to premature death. When evaluating these types of programs in CE analysis, the outcome "life years" often is used to compare them; so the CE ratio can be expressed in terms of cost per life year gained.
Cost per quality-adjusted life year (QALY) gained
As an outcome, life years do not reflect any of the positive or negative effects on the quality of life of the patients receiving an intervention. For example, drug treatment A may provide an additional 2 years of life dominated by hospitalization while drug treatment B may provide an additional 1 year of life without any significant ill effects.
A quality-adjusted life year (QALY) is an outcome measure that considers both the quality and the quantity of life lived. The QALY is based on the number of years of life added by the intervention. Each year in perfect health is assigned the value of 1.0. Each year of less-than-perfect health is assigned a value less than 1.0 down to a value of 0.0 for death. If the extra years would not be lived in full health, for example if the patient would lose a limb, be blind or suffer from worse mental health, then the extra life-years may be given a value of less than 1 to account for this.
HIV interventions intended to improve and/or extend the lives of HIV positive persons can be evaluated to determine the number of additional QALYs gained (or saved) that would have otherwise been lost. When evaluating several such programs in CE analysis, the CE ratio can be expressed in terms of cost per QALY gained.
Most outcome measures, including infections averted, life years gained and new HIV diagnoses, can be translated into QALYs, thereby providing a consistent measure of comparison across many different types of intervention programs.
Cost-Effectiveness Thresholds
A cost-effectiveness ratio of $50,000 to $100,000 per QALY gained has been long cited in the literature as a conservative threshold for a cost-effective intervention. Traditionally, if an intervention was estimated to cost less than $50,000 to $100,000 per QALY gained, it would be considered cost-effective. However, recent studies have argued that this benchmark is likely too low since the threshold has not been reassessed over time.1 To reflect the advances of modern health care, Braithwaite et al reevaluated the threshold and estimated the plausible range for a cost-effectiveness decision rule to be between $109,000 and $297,000 per QALY saved (in 2003 dollars; $143,000-$388,000 in 2010 dollars).2What Does "Cost-Saving" Mean?
When two or more programs are being compared (intervention vs. comparator), the intervention is labeled as "cost-saving" when both the net outcome of the intervention is greater than or equal to that of the comparator and the cost of the intervention is less than the cost of the comparator. A program can only be deemed cost-saving when it is compared to an alternative. The alternative is typically the status quo or the current standard of care.In Example 2, Program A is both cheaper and more beneficial than the current standard of care and is therefore a cost-saving alternative. CE ratios cannot be negative.
If the costs of Program A and the Standard of care are borne by the same institution, then the savings will be reaped by that institution. Often, however, the costs of HIV interventions are borne by many distinct entities, including government, health care systems and individuals, and the savings are not realized by any single entity. In addition, the savings may occur over many years.
How to Interpret a CD Ratio?
At $100,000 per QALY (or at higher thresholds), a program may be considered cost-effective. However, this ratio contains a numerator and a denominator and thus no interpretation can be made as to the annual cost of this program.
In Example 3, both programs A and B have the same measure of cost-effectiveness in terms of cost per QALY gained, however, Program B is more costly to implement than A. Investment in Program B may nonetheless be justified depending on budgetary constraints and the ability to implement for the program in the population and setting considered.
If A and B are complementary rather than alternative programs, then they can both be implemented. Implementing Program A and/or B in a particular population and setting requires an evaluation of the number of persons that potentially could be served by the intervention and the resulting overall costs.
Basic Model Inputs for Cost-Effectiveness Analyses
In this section, we list some of the most recent and significant publications that include key input parameters researchers might use in model-based cost-effectiveness analyses. It is not intended to provide a comprehensive overview of these topic areas -- only to give readers an idea of some key works in the field.Cost of HIV Treatment
A large fraction of the economic burden of HIV/AIDS is the medical costs of treating persons with HIV. Medical cost estimates are often based on health care utilization by persons with HIV disease. The costs associated with health care utilization in each disease stage are summed across all disease stages from infection to death. The average annual cost of HIV care in the ART era was estimated to be $19,912 (in 2006 dollars; $23,000 in 2010 dollars).3 The most recent published estimate of lifetime HIV treatment costs was $367,134 (in 2009 dollars; $379,668 in 2010 dollars).4Cost of Testing
Testing in health care settings
Several U.S.-based studies have evaluated the cost-effectiveness of routine opt-out HIV screening in clinical settings. These settings included emergency departments, primary care settings, urgent care centers, and STD clinics. The results were generally consistent. The cost per new diagnosis ranged from $1,900 to $10,000 (in 2010 dollars), and varied by setting and testing implementation strategy.5-9
Testing in non-health care settings
Non-health care settings, such as jails/prisons, community-based organizations (CBOs), and outreach venues, are also common places to implement HIV testing programs. Individuals eligible for testing in those settings could be identified through partner services or social networks. Cost-effectiveness studies of these strategies have found the results generally consistent within similar settings. For example, the cost per new HIV diagnosis associated with CBO-sponsored activities ranged from $10,334 to $20,413 (2010 dollars).10-11 Variance in the cost per new HIV diagnosis was more pronounced when evaluating HIV testing programs in jails (from $2,946 per new diagnosis in Florida jails to $30,392 in Wisconsin jails),12 reflecting the differences in undiagnosed HIV prevalence among inmates as well as differences in implementation costs.
HIV Survival
The use of highly active antiretroviral therapy (HAART) since 1996 has significantly improved survival for persons infected with HIV. Schackman et al. estimated life expectancy from the time of infection to be 32.1 years from a large dataset of persons in routine outpatient care in the current treatment era.13 Using U.S. national HIV surveillance data, another study estimated that average life expectancy after an HIV diagnosis increased from 10.5 to 22.5 years from 1996 to 2005.14HIV survival data have been reported slightly differently in the literature because of various definitions of timeframe, e.g., time from HIV seroconversion to AIDS, time from seroconversion to death, and time from HIV diagnoses to death. Survival also varies by gender, age at infection, mode of infection, and the timing of initiation of antiretroviral therapy.15-18
HIV Epidemiology
Recent HIV incident estimatesCDC published new incidence estimates in 2011 using a refined methodology that allowed for an updated 2006 incidence estimate (previously 56,300) as well as new estimates for 2007, 2008, and 2009. These new estimates showed that the annual number of new HIV infections was stable overall from 2006 through 2009:19
- In 2006 there were an estimated 48,600 new HIV infections in the United States (95% confidence interval: 42,400-54,700)
- In 2007 there were an estimated 56,000 new HIV infections (95% confidence interval: 49,100-62,900)
- In 2008 there were an estimated 47,800 new HIV infections (95% confidence interval: 41,800-53,800)
- In 2009 there were an estimated 48,100 new HIV infections (95% confidence interval: 42,200-54,000)
HIV Transmission Rate Estimates
HIV transmission risk varies by different modes of transmission. The most common transmission modes include unprotected receptive and insertive anal intercourse, unprotected receptive and insertive vaginal intercourse, and contaminated needle sharing. The estimates of these and other per-act or per-partner transmission probabilities can be found in the listed references of systematic reviews and meta-analyses.20-23Utility Estimate for HIV/AIDS
Many studies have reported quality-of-life estimates for HIV infection and AIDS. Published estimates vary by study design and assessment method.24-25 Tengs et al conducted a meta-analysis of utility estimates for HIV/AIDS to elicit utilities from patients on a scale ranging from 0.0 for death to 1.0 for perfect health. The study is commonly cited for reporting a pooled estimate of utility of 0.70 for AIDS patients, 0.82 for symptomatic HIV patients, and 0.94 for asymptomatic HIV patients [3].26HIV Prevention Data
Annual Cost of HIV by State
We estimated the annual cost of HIV by state based on the number of new HIV diagnoses in each state, multiplied by the lifetime treatment cost discounted to the time of infection for each new case (Table 1). Our cost estimates assume that a diagnosis occurs within the same year as infection, and thus an individual incurs treatment costs over many years. The states with highest number of new diagnoses in 2009, and thus the greatest financial burden, were Florida, California, New York, and Texas. In all, the total lifetime treatment cost for HIV based on new diagnoses in 2009 was estimated to be $16 billion.| Table 1: State-Specific Costs From New Diagnoses of HIV Infection in 2009 | ||
| State | Nb. of New Diagnosesa | Total Lifetime Treatment Costb (in million) |
| Alabama | 690 | $253 |
| Alaska | 21 | $8 |
| Arizona | 653 | $240 |
| Arkansas | 214 | $79 |
| California | 4,886 | $1,794 |
| Colorado | 391 | $144 |
| Connecticut | 366 | $134 |
| Delaware | 168 | $62 |
| District of Columbia | 713 | $262 |
| Florida | 5,775 | $2,120 |
| Georgia | 2,073 | $761 |
| Hawaii | 70 | $26 |
| Idaho | 42 | $15 |
| Illinois | 1,708 | $627 |
| Indiana | 483 | $177 |
| Iowa | 125 | $46 |
| Kansas | 150 | $55 |
| Kentucky | 361 | $133 |
| Louisiana | 1,247 | $458 |
| Maine | 57 | $21 |
| Maryland | 1,400 | $514 |
| Massachusetts | 484 | $178 |
| Michigan | 827 | $304 |
| Minnesota | 393 | $144 |
| Mississippi | 559 | $205 |
| Missouri | 547 | $201 |
| Montana | 30 | $11 |
| Nebraska | 105 | $39 |
| Nevada | 386 | $142 |
| New Hampshire | 43 | $16 |
| New Jersey | 1,252 | $460 |
| New Mexico | 170 | $62 |
| New York | 4,649 | $1,707 |
| North Carolina | 1,719 | $631 |
| North Dakota | 14 | $5 |
| Ohio | 1,144 | $420 |
| Oklahoma | 297 | $109 |
| Oregon | 235 | $86 |
| Pennsylvania | 1,736 | $637 |
| Rhode Island | 123 | $45 |
| South Carolina | 789 | $290 |
| South Dakota | 23 | $8 |
| Tennessee | 999 | $367 |
| Texas | 4,291 | $1,575 |
| Utah | 125 | $46 |
| Vermont | 11 | $4 |
| Virginia | 997 | $366 |
| Washington | 557 | $204 |
| West Virginia | 80 | $29 |
| Wisconsin | 305 | $112 |
| Wyoming | 19 | $7 |
| Total | 44,502 | $16,338 |
| aSource: CDC HIV Surveillance Report 2009, Vol 21. Note that the
numbers of new diagnoses listed in this table do not adjust for reporting delay,
and thus are likely underestimated. bTotal cost = Nb. of new diagnoses* Lifetime treatment cost per person Life treatment cost per person=$367,134 (in 2009 dollars) Source: Schackman BR, Gebo KA, Walensky RP, et al. The lifetime cost of current human immuno-deficiency virus care in the United States. Medical Care 2006; 44: 990-997. | ||
Savings From Prevention Efforts
Farnham et al. (2010) measured the value of HIV prevention efforts in the United States by comparing the difference between the number of infections that have occurred with the number that might have occurred in the absence of prevention programs. Combined with estimates of lifetime treatment costs27 (2009 dollars), the study estimated the medical savings from infections averted by U.S. prevention programs from 1991-2006 to be $129.9 billion with 361,878 HIV infections averted.28References
- Ubel PA, Hirth RA, Chernew ME, Fendrick AM. What is the price of life and why doesn't it increase at the rate of inflation? Arch Intern Med 2003; 163(14): 1637-1641.
- Braithwaite RS, Meltzer DO, King JT Jr, Leslie D, Roberts MS. What does the value of modern medicine say about the $50,000 per quality-adjusted life-year decision rule? Med Care 2008; 46(4): 349-356.
- Gebo KA, Fleishman JA, Conviser R, Hellinger J, Hellinger FJ, Josephs JS, Keiser P, Gaist P, Moore RD; HIV Research Network. Contemporary costs of HIV healthcare in the HAART era. AIDS 2010; 24(17): 2705-2715.
- Schackman BR, Gebo KA, Walensky RP, Losina E, Muccio T, Sax PE, Weinstein MC, Seage GR 3rd, Moore RD, Freedberg KA. The lifetime cost of current human immunodeficiency virus care in the United States. Med Care 2006; 44(11):990-997.
- Phillips KA, Fernyak S. The cost-effectiveness of expanded HIV counseling and testing in primary care settings: a first look. AIDS 2000; 14(14): 2159-2169.
- Walensky RP, Losina E, Malatesta L, Barton GE, O'Connor CA, Skolnik PR, Hall JM, McGuire JF, Freedberg KA. Effective HIV case identification through routine HIV screening at urgent care centers in Massachusetts. Am J Public Health 2005; 95(1): 71-73.
- Silva A, Glick NR, Lyss SB, Hutchinson AB, Gift TL, Pealer LN, Broussard D, Whitman S. Implementing an HIV and sexually transmitted disease screening program in an emergency department. Ann Emerg Med 2007; 49(5): 564-572.
- Mehta SD, Hall J, Greenwald JL, Cranston K, Skolnik PR. Patient risks, outcomes, and costs of voluntary HIV testing at five testing sites within a medical center. Public Health Rep 2008; 123(5): 608-617.
- Farnham PG, Hutchinson AB, Sansom SL, Branson BM. Comparing the costs of HIV screening strategies and technologies in health-care settings. Public Health Rep 2008; 123 Suppl 3: 51-62.
- Shrestha RK, Clark HA, Sansom SL, Song B, Buckendahl H, Calhoun CB, Hutchinson AB, Heffelfinger JD. Cost-effectiveness of finding new HIV diagnoses using rapid HIV testing in community-based organizations. Public Health Rep 2008; 123 Suppl 3: 94-100.
- Golden MR, Gift TL, Brewer DD, Fleming M, Hogben M, St Lawrence JS, Thiede H, Hnadsfield HH. Peer referral for HIV case-finding among men who have sex with men. AIDS; 20(15): 1961-1986.
- Shrestha RK, Sansom SL, Richardson-Moore A, French PT, Scalco B, Lalota M, Llanas M, Stodola J, Macgowan R, Margolis A. Costs of voluntary rapid HIV testing and counseling in jails in 4 states--Advancing HIV Prevention Demonstration Project, 2003-2006. Sex Transm Dis 2009; 36(2 Suppl): S5-S8.
- Schackman BR, Gebo KA, Walensky RP, Losina E, Muccio T, Sax PE, Weinstein MC, Seage GR 3rd, Moore RD, Freedberg KA. The lifetime cost of current human immunodeficiency virus care in the United States. Med Care 2006; 44(11): 990-997.
- Harrison KM, Song RG, Zhang XJ. Life expectancy after HIV diagnosis based on national HIV surveillance data from 25 states, United States. JAIDS 2010; 53(1): 124-130.
- Losina E, Schackman BR, Sadownik SN, Gebo KA, Walensky RP, Chiosi JJ, Weinstein MC, Hicks PL, Aaronson WH, Moore RD, Paltiel AD, Freedberg KA. Racial and sex disparities in life expectancy losses among HIV-infected persons in the United States: impact of risk behavior, late initiation, and early discontinuation of antiretroviral therapy. Clin Infect Dis 2009; 49(10): 1570-1578.
- Phillips AN, Gazzard B, Gilson R, Easterbrook P, Johnson M, Walsh J, Leen C, Fisher M, Orkin C, Anderson J, Pillay D, Delpech V, Sabin C, Schwenk A, Dunn D, Gompels M, Hill T, Porter K, Babiker A; UK Collaborative HIV Cohort Study. Rate of AIDS diseases or death in HIV-infected antiretroviral therapy-naïve individuals with high CD4 cell count. AIDS 2007; 21(13): 1717-1721.
- The Antiretroviral Therapy Cohort Collaboration. Life expectancy of individuals on combination antiretroviral therapy in high-income countries: a collaborative analysis of 14 cohort studies. Lancet 2008; 372: 293-299.
- May M, Compels M, Sabin CA. Impact on life expectancy of late diagnosis and treatment of HIV-1 infected individuals: UK CHIC. Journal of the International AIDS Society 2010; 13 (Suppl 4): O27.
- Prejean J, Song R, Hernandez A, Ziebell R, Green T, Walker F, Lin LS, Mermin J, Lansky A, Hall HI; HIV Incidence Surveillance Group. Estimated HIV Incidence in the United States, 2006-2009. PLoS ONE 2011; 6(8): e17502.
- Boily MC, Baggaley RF, Wang L, Masse B, White RG, Hayes RJ, Alary M. Heterosexual risk of HIV-1 infection per sexual act: systematic review and meta-analysis of observational studies. Lancet Infect Dis 2009; 9(2): 118-129.
- Baggaley RF, White RG, Boily MC, HIV transmission risk through anal intercourse: systematic review, meta-analysis and implications for HIV prevention. Int J Epidemiol 2010; 39(4): 1048-1063.
- Vittinghoff E, Douglas J, Judson F, McKirnan D, MacQueen K, Buchbinder SP. Per-contact risk of human immunodeficiency virus transmission between male sexual partners. Am J Epidemiol 1999; 150(3): 306-311.
- Baggaley RF, Boily MC, White RG, Alary M. Risk of HIV-1 transmission for parenteral exposure and blood transfusion: a systematic review and meta-analysis. AIDS 2006; 20(6): 805-812.
- Bayoumi AM, Redelmeier DA. Economic methods for measuring the quality of life associated with HIV infection. Qual Life Res 1999; 8(6): 471-480.
- Schackman BR, Goldie SJ, Freedberg KA, Losina E, Brazier J, Weinstein MC. Comparison of health state utilities using community and patient preference weights derived from a survey of patients with HIV/AIDS. Med Decis Making 2002; 22(1): 27-38.
- Tengs TO, Lin TH. A meta-analysis of utility estimates for HIV/AIDS. Med Decis Making 2002; 22(6): 475-481.
- Schackman BR, Gebo KA, Walensky RP, Losina E, Muccio T, Sax PE, Weinstein MC, Seage GR 3rd , Moore RD, Freedberg KA. The lifetime cost of current human immunodeficiency virus care in the United States. Med Care 2006; 44(11): 990-997.
- Farnham PG, Holtgrave DR, Sansom SL, Hall HI. Medical costs averted by HIV prevention efforts in the United States, 1991-2006. JAIDS 2010; 54(5): 565-567.
Resources
Cost-Effectiveness Databases
- Tufts Medical Center Cost-Effectiveness Analysis Registry
This U.S.-based database offers detailed information on more than 2,500 English-language cost-effectiveness analyses published in the peer-reviewed medical and economic literature. The original cost per QALY estimates from a wide array of diseases and intervention types are retrieved and updated to the most recent year for comparison purposes.
- National Institute for Health and Clinical Excellence (NICE)
NICE serves the United Kingdom's National Health Services and is well-known for developing and publishing guidelines on public health, health technologies and clinical practice based on evaluations of efficacy and cost-effectiveness evidence. It also sets quality standards and manages a national database for high-quality, cost-effective patient care, covering the treatment and prevention of different diseases and conditions. NICE provides access to quality information and best practices so that care decisions can be made based on the best possible evidence.
- NHS Economic Evaluation Database (EED)
This UK-based database focuses on the economic evaluation of health care interventions, including cost-benefit analyses, cost-utility analyses, and cost-effectiveness analyses. Extensive literature searches are undertaken each week, and brief details from eligible studies are published on the database. Studies that are relevant to the UK health care system are considered priorities for writing abstracts, which include a non-technical summary of the topic, conclusions, and a brief description of the effectiveness information. A critical commentary summarizes the overall reliability and generalizability of the study.
Cost Inflation Tool
Consumer Price Index (CPI)The Consumer Price Index (CPI) is a measure of the average change over time in the prices paid by urban consumers for a market basket of consumer goods and services. Every month the Bureau of Labor Statistics (BLS) surveys prices and generates the CPI. The CPI includes all consumer expenditure items in more than 200 categories, arranged into eight major CPI components, such as housing, transportation, medical care, etc. Researchers often use the medical care component of the CPI to adjust health care costs reported in previous years to their value in current dollars.Historic CPI series and component data can be found at the Bureau of Labor Statistics website: www.bls.gov/cpi/.
How to adjust medical costs using CPI
The formula for calculating current costs using the CPI is relatively simple. Assume the medical care component of CPI for year 1990 is 125. A CPI for year 2000 of 175 indicates a 1.4 cost adjustment or a 40% increase in medical-related expenditures since 1990.
| Year | Medical Care Component of CPI | Inflation Rate From Year 1 to Year 5 |
| 1990 | 125 | 175/125=1.4 |
| 2000 | 175 |
Assume the medical costs for condition X are estimated to be $10,000 per patient in year 1990. By multiplying $10,000 by 1.4, we get the value of the medical costs for condition X in 2000. In other words, treatment valued at $10,000 in 1990 would cost $14,000 in 2000.
Additional Prevention Modeling and Economics Team (PMET) Publications
- Prabhu VS, Farnham PG, Hutchinson AB, Soorapanth S, Heffelfinger JD, Golden MR, Brooks JT, Rimland D, Sansom SL. Cost-effectiveness of HIV screening in STD clinics, emergency departments, and inpatient units: a model-based analysis. PLoS One 2011; 6(5): e19936.
- Hutchinson AB, P. Patel, S. L. Sansom, P. G. Farnham, T. J. Sullivan, B. Bennett, P. R. Kerndt, R. K. Bolan, J. D. Heffelfinger, V. S. Prabhu, and B. M. Branson. Cost-effectiveness of pooled nucleic acid amplification testing for acute HIV infection after third-generation HIV antibody screening and rapid testing in the United States: a comparison of three public health settings. PLoS Med 2010; 7: e1000342.
- Prabhu VS, Hutchinson AB, Farnham PG, Sansom SL. Sexually acquired infections in the United States due to acute-phase HIV transmission: an update. AIDS 2009;23(13): 1792-1794.
- Sansom SL, Hutchinson AB, An Q, Hall I, Shrestha RK, Prabhu VS, Lasry A, Taylor A. Cost-effectiveness of newborn circumcision in preventing HIV among U.S. males. PLoS One 2010; 5(1): e8723.
- Hutchinson AB, Farnham PG, Duffy N, Wolitski RJ, Sansom SL, Dooley SW, Cleveland JC, Mermin JH. Return on public health investment: CDC's expanded HIV testing initiative. JAIDS 2011 (Epub ahead of print).
HCV Screen Based on Birth Cohort Proves Cost-Effective
By Kristina Fiore, Staff Writer, MedPage Today
Published: January 02, 2012
Reviewed by Robert Jasmer, MD; Associate Clinical Professor of Medicine, University of California, San Francisco.
Screening patients for hepatitis C virus (HCV) based on their age rather than their risk was cost-effective, researchers found.
Birth-cohort screening would cost between $15,700 and $35,700 per quality of life year (QALY) saved depending on the treatment strategy, putting it in a cost-effectiveness range with other widely implemented preventive interventions, David Rein, PhD, of the University of Chicago, and colleagues reported in the Annals of Internal Medicine.
"[It] appears to be a reasonable strategy to identify asymptomatic cases of HCV," they wrote.
The CDC currently recommends screening patients who may be at risk of HCV, such as injection-drug users or those with elevated alanine aminotransferase levels.
But no more than 50% of patients who are chronically infected with the virus are aware of their status. That may be a result of difficulty implementing risk-based screening methods or the awkwardness of discussing behavioral risks, the researchers said.
Expanding screening recommendations to cover patients born between 1945 and 1965 -- those in whom prevalence of HCV is highest -- may be a complement or alternative to risk-based screening, they wrote, although its impact on healthcare costs has been unknown.
So to estimate the cost-effectiveness of birth cohort screening, Rein and colleagues used data from the National Health and Nutrition Examination Survey (NHANES) 2001-2006 on patients who had at least one or more annual visits to a primary care doctor.
They found that, compared with current practices, birth cohort screening identified an estimated 808,580 additional cases of chronic HCV infection at a cost of $2,874 per case identified.
If birth cohort screening was followed by standard treatment with pegylated interferon and ribavirin, screening increased QALYs by 348,800 and costs by $5.5 billion, for an incremental cost-effectiveness ratio (ICER) of $15,700 per QALY gained.
They added that treatment would prevent 82,300 deaths.
If screening were followed by standard-of-care pegylated interferon plus ribavirin in addition to a direct-acting antiviral, a newer class of HCV drugs, QALYs would be increased by 532,200 and costs by $19 billion, amounting to an ICER of $35,700 per QALY saved.
This treatment strategy would prevent 121,000 deaths, the researchers estimated.
They wrote that although there's no accepted standard for determining what level of cost-effectiveness justifies implementing of a new screening strategy, HCV birth-cohort screening appears to rank on par with colorectal cancer screening, hypertension screening, influenza vaccination of adults ages 50 and up, and vision screening and pneumococcal vaccination of patients ages 65 and up.
They warned that the study had several limitations, including relying on the assumption that patients without insurance weren't offered treatment. Also, cost-effectiveness estimates of direct-acting antivirals plus standard treatment were speculative because actual data on their clinical implementation haven't yet been reported.
They also cautioned that disease progress was capped at 20 years, which may be an underestimate, and the study may lack generalizability because NHANES data don't include information on institutionalized or homeless patients, who may be at risk of HCV.
The study was supported by the CDC.
The researchers reported no conflicts of interest.
Primary source: Annals of Internal Medicine
Source reference:
Rein DB, et al "The cost-effectiveness of birth cohort screening for hepatitis C antibody in U.S. primary care settings" Ann Intern Med 2011.
Hepatitis C virus survives by hijacking liver microRNA: study
Viral diseases are still one of the biggest challenges to medical science. Thanks to thousands of years of co-evolution with humans, their ability to harness the biology of their human hosts to survive and thrive makes them very difficult to target with medical treatment
Scientists at the University of North Carolina at Chapel Hill, working with colleagues from the University of Colorado, have shown for the first time how a small RNA molecule that regulates gene expression in human liver cells has been hijacked by the hepatitis C virus to ensure its own survival – helping medical scientists understand why a new antiviral drug appears to be effective against the virus.
MicroRNAs are involved in regulating the expression of genes in cells, usually by blocking the production of key proteins or by destabilizing the messenger RNAs that encode the cell's proteins as it grows and divides. Normally they act by downregulating gene expression. The research team found that the binding of a prominent microRNA in liver cells, called miR-122, to the viral RNA results in its stabilization, promoting efficient replication of the virus genome in the liver and supporting the virus' lifecycle.
"The hepatitis C virus has done two very interesting things with miR-122," says Stanley M. Lemon, MD, professor of medicine and microbiology and immunology and a member of UNC Lineberger Comprehensive Cancer Center and the Center for Translational Immunology.
"First, it has evolved a unique relationship with a key regulator, since miR-122 represents about half of all microRNAs present in the liver. Second, the virus has usurped a process that usually downregulates gene expression to upregulate the stability of its RNA and expression of viral proteins needed for its lifecycle. It's a classic example of how viruses subvert normally beneficial functions of the cell to their own nefarious purposes."
Work by Dr. Lemon and his colleagues in 2005 helped to demonstrate that miR-122 was required for hepatitis C to replicate itself, but the mechanism was not understood. Now the UNC research team has shown how it works, which helps to explain how a new experimental antiviral drug target the virus. The drug, called an "antagomer", binds to miR-122 and sequesters it in the liver and thus destabilizes the viral genome, accelerating its degradation in the liver. Results of the most recent study are published online this week in the journal Proceedings of the National Academy of Sciences.
Hepatitis C is a continuing public health problem, which is difficult to measure because symptoms occur months to years after infection. The Centers for Disease Control and Prevention estimates as many as 4 million people in the United States may be persistently infected with hepatitis C virus, and most do not know they are infected. More than a third of those who are long-term carriers may develop chronic liver disease or liver cancer, a deadly form of cancer that is becoming increasingly common due to the spread of this virus.
Provided by University of North Carolina
Tailor-Made Therapy for Viral Hepatitis: Recent Advances
Paper
Masatoshi Kudo
Department of Gastroenterology and Hepatology, Kinki University School of Medicine, Osaka-Sayama, Japan
Address of Corresponding Author
Digestion 2011;84 (Suppl. 1):1-4 (DOI: 10.1159/000333207)
Abstract
Combination therapy of pegylated interferon-α with ribavirin (PEG-IFN/RBV) is a standard of care for chronic hepatitis C (CHC). The majority of CHC patients are infected with HCV genotype I. The recent discovery revealed by a genome-wide association study technology provides the important role of interleukin-28B (IL28B) and inosine triphosphatase (ITPA) in HCV infection. In addition, response to PEG-IFN/RBV therapy is correlated with insulin resistance, hepatic steatosis, and hepatic fibrosis in CHC patients. Double-filtration plasmapheresis together with IFN therapy has proved to be effective in the reduction of viral load during the early stage of treatment. In CHC patients, not only IL28B status, but also the treatment period of PEG-IFN/RBV is important. Even when new polymerase/protease inhibitors are introduced in the treatment of CHC, tailor-made treatment for CHC using IL28B, inosine triphosphatase testing or double-filtration plasmapheresis treatment prolonged treatment strategy is highly recommended. The relative etiologic role of prior hepatitis B virus infection in the development of non-B non-C hepatocellular carcinoma is also known in hepatitis B-endemic areas.
Copyright © 2011 S. Karger AG, Basel
The 8th Japan-Korea Liver Symposium, the main theme of which was ‘Tailor-made therapy of viral hepatitis’, was held in Kobe, Japan, on July 17, 2011, to focus on and discuss current topics in viral hepatitis. The symposium was full of enlightening lectures by world’s leading scientists, followed by extensive discussions. This supplement issue of Digestion contains the most important articles presented at this meeting.
Insulin Resistance
Insulin resistance (IR) has been reported to be an independent predictor of treatment outcome in chronic hepatitis C (CHC) patients.
Associations among IR, steatosis and liver fibrosis have been observed in CHC patients [1,2,3,4,5]. IR has been suggested as the cause, more than a consequence, of hepatic steatosis and fibrosis in patients with HCV, particularly in those with genotype 1 infection [6]. The mechanisms of the more obvious and crucial influence of IR, more than steatosis and fibrosis, need further study. IR seems to be at least associated with body mass index and steatosis, but not with hepatic fibrosis [7].
Double-Filtration Plasmapheresis
The use of double-filtration plasmapheresis (DFPP), approved in Japan in April 2008 for the retreatment of chronic CHC patients with genotype 1b and high viral loads, together with IFN administration has produced a substantial reduction in the viral load during the early stages of treatment and has effected a high sustained virological response (SVR) [8,9], suggesting that this treatment is a new modality for difficult-to-treat CHC patients.
Recent reports have revealed factors associated with response to pegylated interferon-α with ribavirin (PEG-IFN/RBV) therapy such as single nucleotide polymorphisms (SNPs), as host genetic factors, located in interleukin-28B (IL28B; rs8105790, rs11881222, rs8103142, rs28416813, rs4803219, rs8099917, rs7248668, and rs12979860) on chromosome 19 [10,11,12,13]; amino acid (aa) substitutions in nonstructural protein 5a, especially those in the IFN/RBV resistance-determining region [14] and the IFN sensitivity-determining region (ISDR) [15], and the core regions of HCV [16], as viral genetic polymorphisms.
Kim et al. [17] reported that early viral dynamics with DFPP + IFN-β/RBV then PEG-IFN/RBV therapy is superior to the previous PEG-IFN/RBV combination therapy. There was a significant difference in viral reduction at 24 and 48 h, and 1, 2, 4, 8 and 12 weeks between non-viral response (NVR) and relapse patients. The rate of rapid viral response (RVR) and complete early viral response (cEVR) showed a significant difference between NVR and relapse patients: among the 20 patients, RVR was obtained in 75% (6/8) of relapse patients but in 0% (0/12) of NVR patients, and cEVR in 88% (7/8) of relapse patients but in only 8% (1/12) of NVR patients. On the basis of the above results, DFPP + IFN-β/RBV then PEG-IFN/RBV therapy is indicated more for relapse than for NVR patients. We could conclude that relapse patients would be better candidates than NVR patients [17].
IL28B and Inosine Triphosphatase
The recent discovery revealed by a genome-wide association study (GWAS) technology provides the unexpected role of IL28B and inosine triphosphatase (ITPA) in HCV infection. The former SNPs around the IL28B gene could improve the diagnostics on the prediction of spontaneous clearance and the response to anti-HCV treatment, suggesting that these findings could be strong evidence to enhance the development of a novel therapeutic strategy and the basic study of IFN-λs. Interestingly, the discovered IL28B SNPs revealed the enigma that the viral clearance rate was dependent on ethnic type. The latter functional SNP in ITPA locus was the most significant SNP associated with RBV-induced anemia as well as IFN-induced thrombocytopenia. Note that severe Hb decline, which is mainly found in ITPA-CC patients, was inversely correlated with platelet reduction, contributing to an association between severe anemia and relative reactive increase in platelet count.
The efficacy of triple therapy of telaprevir/PEG-IFN/RBV was high in the patients with genotype TT (rs8099917), who achieved SVR (84%), irrespective of substitution of core aa70. In the patients having genotype non-TT, those of Arg70 gained high SVR rate (50%), and SVR rate (12%) was the worst in patients who possessed both genotype non-TT and Gln70 (His70), suggesting genetic variation near the IL28B gene and aa substitution of the core region as predictors of SVR to a triple therapy in Japanese patients infected with HCV genotype 1b [18].
Genetic variants leading to ITPA deficiency, a condition not thought to be clinically important, protect against hemolytic anemia in CHC patients receiving RBV [19]. Results obtained in one GWAS study need to be evaluated in the context of different geographical and racial populations and independent cohorts. Tanaka confirmed that ITPA SNP (rs1127354) was a useful predictor of RBV-induced anemia in Japanese patients [20]. Excluding those with genotype 1b and high viral load, patients with ITPA minor variant A achieved significantly higher SVR rates than those with the major variant (CC; 96 vs. 70%, respectively, p = 0.0066) [20]. Because the typical PEG-IFN/RBV treatment period is shorter (24 weeks) in genotype 1 low viral load and genotype 2 patients than in genotype 1 high viral load (48 weeks) patients, early dose reduction in RBV may be more critical for the final outcome.
The recent discovery revealed by GWAS technology provides the unexpected role of IL28B and ITPA in HCV infection. These data may provide a valuable pharmacogenetic diagnostic tool for tailoring PEG-IFN/RBV dosing to minimize drug-induced adverse events and for further optimization of clinical anti-HCV chemotherapeutics.
Total PEG-IFN Dose, Core 70 Substitution and ISDR Substitution
Takita et al. [21] showed in their multivariate analysis that rs8099917 genotype and total PEG-IFN dose contribute to the successful outcome of PEG-IFN plus ribavirin combination treatment for infection with HCV genotype 1. The study indicated the value of a combination of the rs8099917 genotype and core 70 substitutions for prediction of SVR. The patients with the rs8099917 genotype TT had high rates of SVR (67.9%). SVR was achieved by 30.7% of patients with the rs8099917 genotype non-TT and core 70 wild type. The SVR rate was worst in patients with rs8099917 genotype non-TT and core 70 mutant type. These results indicate the effects of both host and viral factors on IFN responsiveness. However, a combination of the IL28 genotype and ISDR substitutions for prediction of SVR was not useful.
Etiologic Role of Prior Hepatitis B Infection and Nonalcoholic Steatohepatitis on Hepatocellular Carcinoma Occurrence
A previous study on 1,145 Korean patients showed that the prevalence of cryptogenic hepatocellular carcinoma (HCC) was significantly increased during the last decade, and patients with cryptogenic HCC had a tendency to have risk factors for nonalcoholic fatty liver disease (NAFLD) such as DM, hypertension and obesity than those with virus or alcohol-related HCC [22]. It can be assumed that the increased proportion of risk factors for NAFLD may contribute to the development of cryptogenic HCC. However, there has been no study to compare the relative etiological role of prior HBV infection and NAFLD in the development of NBNC-HCC in HBV-endemic areas. Cho et al. [23] show in their study that the relative proportion of NAFLD-related HCC increased more than three times during the past 10 years, while that of prior HBV infection-related HCC decreased. A growing trend towards a rise in NAFLD-related HCC is expected in the near future, while the prevalence of new HBV infection has definitely decreased due to universal vaccination programs but that of NAFLD has increased recently [24].
Predictions of HBsAg Seroclearance
In chronic HBV infections, HBsAg seroclearance reportedly occurs at a rate of 0.50–2.26%. Several factors have been suggested to be associated with seroclearance including age and HBeAg negativity. However, there are few studies evaluating whether HBV DNA levels are an independent predictor of HBsAg seroclearance.
Old age, a sustained inactive phase, and low levels of HBV DNA were the independent predictors of HBsAg seroclearance [25]. The authors showed that HBsAg seroclearance occurred at a rate of 1.8% per year in HBeAg-negative chronic hepatitis B patients. In addition, multivariable analysis suggested that low HBV DNA levels, old age, and sustained inactive phase were independent predictors of HBsAg seroclearance, but use of antiviral agents was not. Therefore, spontaneous HBsAg seroclearance takes place in elderly patients with low serum HBV DNA levels (<2,000 IU/ml) who remain in a sustained inactive phase.
Non-B Non-C HCC
NBNC-HCC is associated with several etiologic factors such as alcoholic liver diseases (ALD) autoimmune hepatitis, primary biliary cirrhosis, primary sclerosing cholangitis, and NAFLD/nonalcoholic steatohepatitis. In addition, a variety of clinical factors are also involved in the development and progression of NBNC-HCC, including age, sex, alcohol consumption, and diabetes mellitus [26,27]. There are only a few reports, however, on the clinical characteristics of NBNC-HCC, and the actual state of NBNC-HCC has not been fully elucidated [28,29,30,31].
Although the number of patients with NBNC-HCC has been increasing annually, many features of NBNC-HCC remain unknown. Based on the present study, the most common etiologic factor for NBNC-HCC was alcohol, and diabetes may be related to the occurrence of HCC in patients with non-alcohol-related liver disease. The comparison between groups revealed that non-ALD-HCC tended to be detected at a more advanced stage, whereas liver function in ALD-HCC was worse. Finally, the prognosis was equivalent between groups [32].
Conclusion
Tailor-made treatment for chronic hepatitis is a very important issue to be addressed even when new polymerase/protease inhibitors are available.
Disclosure Statement
The author has no conflict of interest to declare.
References
- 1
- Hsieh MH, Lee LP, Hsieh MY, Tsai KB, Huang JF, Hou NJ, Chen SC, Lin ZY, Wang LY, Dai CY, et al: Hepatic steatosis and fibrosis in chronic hepatitis C in Taiwan. Jpn J Infect Dis 2007;60:377–381.
- 2
- D’Souza R, Sabin CA, Foster GR: Insulin resistance plays a significant role in liver fibrosis in chronic hepatitis C and in the response to antiviral therapy. Am J Gastroenterol 2005;100:1509–1515.
- 3
- Muzzi A, Leandro G, Rubbia-Brandt L, James R, Keiser O, Malinverni R, Dufour JF, Helbling B, Hadengue A, Gonvers JJ, et al: Insulin resistance is associated with liver fibrosis in non-diabetic chronic hepatitis C patients. J Hepatol 2005;42:41–46.
- 4
- Sud A, Hui JM, Farrell GC, Bandara P, Kench JG, Fung C, Lin R, Samarasinghe D, Liddle C, McCaughan GW, et al: Improved prediction of fibrosis in chronic hepatitis C using measures of insulin resistance in a probability index. Hepatology 2004;39:1239–1247.
- 5
- Zekry A, McHutchison JG, Diehl AM: Insulin resistance and steatosis in hepatitis C virus infection. Gut 2005;54:903–906.
- 6
- Fartoux L, Poujol-Robert A, Guechot J, Wendum D, Poupon R, Serfaty L: Insulin resistance is a cause of steatosis and fibrosis progression in chronic hepatitis C. Gut 2005;54:1003–1008.
- 7
- Kim SR, Saito J, Imoto S, Komaki T, Nagata Y, Nakajima T, Ando K, Fukuda K: Correlation between insulin resistance and outcome of pegylated interferon and ribavirin therapy, hepatic steatosis, hepatic fibrosis in chronic hepatitis C-1b and high viral load. Digestion, this issue.
- 8
- Fujiwara K, Kaneko S, Kakumu S, Sata M, Hige S, Tomita E, Mochida S: Double filtration plasmapheresis and interferon combination therapy for chronic hepatitis C patients with genotype 1 and high viral load. Hepatol Res 2007;37:701–710.
- 9
- Kaneko S, Sata M, Ide T, Yamashita T, Hige S, Tomita E, Mochida S, Yamashita Y, Inui Y, Kim SR, et al: Efficacy and safety of double filtration plasmapheresis in combination with interferon therapy for chronic hepatitis C. Hepatol Res 2010;40:1072–1081.
- 10
- Tanaka Y, Nishida N, Sugiyama M, Kurosaki M, Matsuura K, Sakamoto N, Nakagawa M, Korenaga M, Hino K, Hige S, et al: Genome-wide association of IL28B with response to pegylated interferon-alpha and ribavirin therapy for chronic hepatitis C. Nat Genet 2009;41:1105–1109.
- 11
- Ge D, Fellay J, Thompson AJ, Simon JS, Shianna KV, Urban TJ, Heinzen EL, Qiu P, Bertelsen AH, Muir AJ, et al: Genetic variation in IL28B predicts hepatitis C treatment-induced viral clearance. Nature 2009;461:399–401.
- 12
- Suppiah V, Moldovan M, Ahlenstiel G, Berg T, Weltman M, Abate ML, Bassendine M, Spengler U, Dore GJ, Powell E, et al: IL28B is associated with response to chronic hepatitis C interferon-alpha and ribavirin therapy. Nat Genet 2009;41:1100–1104.
- 13
- Rauch A, Kutalik Z, Descombes P, Cai T, Di Iulio J, Mueller T, Bochud M, Battegay M, Bernasconi E, Borovicka J, et al: Genetic variation in IL28B is associated with chronic hepatitis C and treatment failure: a genome-wide association study. Gastroenterology 2010;138:1338–1345, 1345, e1331–e1337.
- 14
- El-Shamy A, Nagano-Fujii M, Sasase N, Imoto S, Kim SR, Hotta H: Sequence variation in hepatitis C virus nonstructural protein 5A predicts clinical outcome of pegylated interferon/ribavirin combination therapy. Hepatology 2008;48:38–47.
- 15
- Enomoto N, Sakuma I, Asahina Y, Kurosaki M, Murakami T, Yamamoto C, Ogura Y, Izumi N, Marumo F, Sato C: Mutations in the nonstructural protein 5A gene and response to interferon in patients with chronic hepatitis C virus 1b infection. N Engl J Med 1996;334:77–81.
- 16
- Akuta N, Suzuki F, Kawamura Y, Yatsuji H, Sezaki H, Suzuki Y, Hosaka T, Kobayashi M, Arase Y, Ikeda K, et al: Predictive factors of early and sustained responses to peginterferon plus ribavirin combination therapy in Japanese patients infected with hepatitis C virus genotype 1b: amino acid substitutions in the core region and low-density lipoprotein cholesterol levels. J Hepatol 2007;46:403–410.
- 17
- Kim SR, Saito J, Imoto S, Komaki T, Nagata Y, Kim KI, Sasase N, Kimura N: Double-filtration plasmapheresis plus interferon-β for HCV-1b patients with non-sustained virogical response to previous combination therapy. Digestion, this issue.
- 18
- Akuta N, Suzuki F, Hirakawa M, Kawamura Y, Yatsuji H, Sezaki H, Suzuki Y, Hosaka T, Kobayashi M, Saitoh S, et al: Amino acid substitution in hepatitis C virus core region and genetic variation near the interleukin 28B gene predict viral response to telaprevir with peginterferon and ribavirin. Hepatology 2010;52:421–429.
- 19
- Fellay J, Thompson AJ, Ge D, Gumbs CE, Urban TJ, Shianna KV, Little LD, Qiu P, Bertelsen AH, Watson M, et al: ITPA gene variants protect against anaemia in patients treated for chronic hepatitis C. Nature 2010;464:405–408.
- 20
- Sakamoto N, Tanaka Y, Nakagawa M, Yatsuhashi H, Nishiguchi S, Enomoto N, Azuma S, Nishimura-Sakurai Y, Kakinuma S, Nishida N, et al: ITPA gene variant protects against anemia induced by pegylated interferon-alpha and ribavirin therapy for Japanese patients with chronic hepatitis C. Hepatol Res 2010;40:1063–1071.
- 21
- Takita M, Hagiwara H, Arizumi T, Hayaishi S, Ueda T, Kitai S, Yada N, Inoue T, Minami Y, Chung H, et al: Association of interleukin-28B and hepatitis C genotype 1 with a high viral load and response to pegylated interferon plus ribavirin therapy. Digestion, this issue.
- 22
- Oh KC, Park SH, Park JC, Jin DK, Park CS, Kim KO, Jang HJ, Lee JY, Park CH, Han TH, et al: Is the prevalence of cryptogenic hepatocellular carcinoma increasing in Korea? (in Korean). Korean J Gastroenterol 2005;45:45–51.
- 23
- Cho EJ, Kwack MS, Jang ES, You SJ, Lee JH, Kim JY, Yoon JH, Lee HS: Relative etiological role of prior hepatitis B virus infection and nonalcoholic fatty liver disease in the development of non-B non-C hepatocellular carcinoma in a hepatitis B-endemic area. Digestion, this issue.
- 24
- Park NH, Chung YH, Lee HS: Impacts of vaccination on hepatitis B viral infections in Korea over a 25-year period. Intervirology 2010;53:20–28.
- 25
- Kwak MS, Cho EJ, Jang ES, Lee JH, Yu SJ, Kim YJ, Yoon JH, Lee HS: Predictors of HBsAg seroclearance in HBeAg-negative chronic hepatitis B patients. Digestion, this issue.
- 26
- Fattovich G, Stroffolini T, Zagni I, Donato F: Hepatocellular carcinoma in cirrhosis: incidence and risk factors. Gastroenterology 2004;127(suppl 1):S35–S50.
- 27
- Hassan MM, Hwang LY, Hatten CJ, Swaim M, Li D, Abbruzzese JL, Beasley P, Patt YZ: Risk factors for hepatocellular carcinoma: synergism of alcohol with viral hepatitis and diabetes mellitus. Hepatology 2002;36:1206–1213.
- 28
- Abe H, Yoshizawa K, Kitahara T, Aizawa R, Matsuoka M, Aizawa Y: Etiology of non-B non-C hepatocellular carcinoma in the eastern district of Tokyo. J Gastroenterol 2008;43:967–974.
- 29
- Hatanaka K, Kudo M, Fukunaga T, Ueshima K, Chung H, Minami Y, Sakaguchi Y, Hagiwara S, Orino A, Osaki Y: Clinical characteristics of NonBNonC-HCC: comparison with HBV and HCV related HCC. Intervirology 2007;50:24–31.
- 30
- Kawaguchi T, Kakuma T, Yatsuhashi H, Watanabe H, Saitsu H, Nakao K, Taketomi A, Ohta S, Tabaru A, Takenaka K, et al: Data mining reveals complex interactions of risk factors and clinical feature profiling associated with the staging of non-hepatitis B virus/non-hepatitis C virus-related hepatocellular carcinoma. Hepatol Res 2011;41:564–571.
- 31
- Hashimoto E, Taniai M, Kaneda H, Tokushige K, Hasegawa K, Okuda H, Shiratori K, Takasaki K: Comparison of hepatocellular carcinoma patients with alcoholic liver disease and nonalcoholic steatohepatitis. Alcohol Clin Exp Res 2004;28(suppl 2):164S–168S.
- 32
- Kim SR, Marusawa H, Eso Y, Nishikawa H, Ueda Y, Kita R, Kimura T, Chiba T, Osaki Y, Kudo M: Clinical characteristics ofnon-B non-C hepatocellular carcinoma: a single-center retrospective study. Digestion, this issue.
Author Contacts
Masatoshi Kudo
Department of Gastroenterology and Hepatology
Kinki University School of Medicine
Ohno-Higashi, Osaka-Sayama 589-8511 (Japan)
Article Information
Published online: December 2, 2011
Number of Print Pages : 4
Number of Figures : 0, Number of Tables : 0, Number of References : 32
Publication Details
Digestion (International Journal of Gastroenterology)
Vol. 84, No. Suppl. 1, Year 2011 (Cover Date: December 2011)
Journal Editor: Göke B. (Munich), Shinomura Y. (Sapporo)
ISSN: 0012-2823 (Print), eISSN: 1421-9867 (Online)
For additional information: http://www.karger.com/DIG
Tel. +81 72 366 0221, E-Mail m-kudo@med.kindai.ac.jp
Subscribe to:
Posts (Atom)